Table of contents
Chronic pain is now one of the most common health conditions in the United States, affecting more people than diabetes or major depression, and it is still rising. In 2023 it affected close to one in four adults, and the cost it imposes on the country runs into the hundreds of billions of dollars a year. Here is chronic pain by the numbers, updated for 2026.
The headline numbers
Chronic pain in four figures.
How common it is
Roughly one in four adults.
According to the CDC's 2023 National Health Interview Survey, 24.3% of US adults reported chronic pain, meaning pain on most days or every day over the previous three months. That is more than 60 million people, making chronic pain more common than diabetes or major depression.
Share of US adults reporting chronic pain in the past three months. Source: CDC National Health Interview Survey, 2023 (NCHS Data Brief No. 518).
The trajectory
It climbed sharply after 2019.
Chronic pain prevalence had been relatively stable, then jumped in the post-pandemic period. Between 2019 and 2023, chronic pain rose from 20.4% to 24.3% of adults, and high-impact chronic pain, the form that frequently limits work or daily activities, climbed from 7.4% to 8.5%. That four-point move represents roughly 10 million additional people in just four years.
Prevalence among US adults, 2019 versus 2023. Source: CDC National Health Interview Survey (NCHS Data Brief No. 518).
Who carries it
Women report it more than men.
One of the most consistent patterns in pain research is the gender gap. In 2023, women were more likely than men to report both chronic pain and the high-impact form that interferes with daily life. The difference is widest for high-impact pain, where the female rate is roughly a third higher.
Prevalence by sex, US adults, 2023. Source: CDC National Health Interview Survey (NCHS Data Brief No. 518).
The age gradient
It rises steeply with age.
Chronic pain climbs with every decade of life. Among adults 65 and older, 36% reported chronic pain in 2023, nearly three times the rate among adults under 30. High-impact chronic pain follows the same curve, more than quadrupling from the youngest to the oldest group.
Prevalence by age group, US adults, 2023. Source: CDC National Health Interview Survey (NCHS Data Brief No. 518).
The full breakdown
Chronic pain by demographic.
The complete 2023 picture, across sex, age, race and ethnicity, and how urban or rural a person's county is. Where a high-impact figure was not separately reported in the source, it is marked N/R.
| Group | Chronic pain | High-impact |
|---|---|---|
| All US adults | 24.3% | 8.5% |
| Sex | ||
| Men | 23.2% | 7.3% |
| Women | 25.4% | 9.6% |
| Age group | ||
| 18-29 | 12.3% | 3.0% |
| 30-44 | 18.3% | 4.9% |
| 45-64 | 28.7% | 11.3% |
| 65 and older | 36.0% | 13.5% |
| Race and Hispanic origin | ||
| Am. Indian / Alaska Native | 30.7% | 12.7% |
| White | 28.0% | N/R |
| Other / multiple races | 24.8% | N/R |
| Black | 21.7% | N/R |
| Hispanic | 17.1% | N/R |
| Asian | 11.8% | 2.6% |
| Urbanization level | ||
| Large central metro | 20.5% | 7.3% |
| Large fringe metro | 22.5% | N/R |
| Medium and small metro | 26.4% | N/R |
| Nonmetropolitan | 31.4% | 11.5% |
Source: CDC National Health Interview Survey, 2023 (NCHS Data Brief No. 518). Differences among some racial and ethnic groups were not statistically significant.
Racial and ethnic gaps
A nearly threefold spread.
American Indian and Alaska Native adults reported the highest chronic pain rate of any group at 30.7%, while Asian adults reported the lowest at 11.8%, a gap of nearly three to one. These differences reflect a mix of occupational, access-to-care, and socioeconomic factors.
Chronic pain prevalence by race and Hispanic origin, US adults, 2023. Source: CDC National Health Interview Survey (NCHS Data Brief No. 518).
The rural gap
It is higher outside big cities.
Adults living in nonmetropolitan areas report higher rates of chronic pain than those in large metropolitan areas. The nonmetro rate was 31.4%, more than ten points higher than in large central metro areas. Multiple factors may contribute to this disparity, including occupational exposures, healthcare access, socioeconomic differences, and population age.
Chronic pain prevalence by county urbanization level, US adults, 2023. Source: CDC National Health Interview Survey (NCHS Data Brief No. 518).
The cost
A $722.8 billion burden.
A 2021 analysis published in the journal Medical Care put the total economic cost of chronic pain in the US at $722.8 billion a year. About three quarters of that is direct medical care, with the rest coming from lost work productivity. On a per-person basis, an adult with chronic pain incurs roughly $8,068 in additional annual medical costs and $2,923 in lost productivity compared with someone without it.
US economic cost of chronic pain, 2021, by component. Source: Economic Costs of Chronic Pain, Medical Care (2025).
The cost, itemized
Where the money goes.
| Cost component | Amount (US, per year) |
|---|---|
| Total economic cost (2021) | $722.8B |
| Direct medical care | $530.6B |
| Lost work productivity | $192.2B |
| Excess medical cost, per person | $8,068 |
| Excess productivity loss, per person | $2,923 |
| Earlier estimate (2010 dollars, Gaskin & Richard) | $560 to 635B |
Sources: Medical Care (2025) for 2021 figures; The Journal of Pain (Gaskin & Richard, 2012) for the earlier estimate.
In perspective
Costlier than the conditions we fear most.
The landmark 2012 Johns Hopkins study by Gaskin and Richard found that the annual cost of pain exceeded the combined economic toll of the nation's most feared conditions. In 2010 dollars, pain cost more than heart disease, cancer, and diabetes individually, a ranking that still holds today.
Annual US economic cost, 2010 dollars. Source: Gaskin and Richard, The Journal of Pain (2012). A 2021 analysis later put the pain figure at $722.8 billion.
The global picture
A worldwide epidemic, still growing.
Chronic pain is not a uniquely American problem. Low back pain alone, the single leading cause of disability worldwide, affected about 619 million people in 2020. With aging populations and more sedentary work, the Global Burden of Disease study projects that figure will reach roughly 843 million by 2050, an increase of more than a third.
People living with low back pain worldwide. Source: Global Burden of Disease study, The Lancet Rheumatology (2023).
Beyond the body
The reach into daily life.
The numbers that capture prevalence and cost still understate the experience. Surveys of people living with chronic pain consistently show it bleeding into sleep, mood, energy, focus, and the simple enjoyment of life. Sleep disturbance is one of the most commonly reported consequences, and poor sleep can in turn worsen pain the next day, a bidirectional relationship.
Share of people with chronic pain reporting each impact. Source: Institute of Medicine, Relieving Pain in America (2011), drawing on an American Pain Foundation survey.
The takeaway
A condition hiding in plain sight.
Put together, the data describes a condition that is enormous in scale, unevenly distributed, expensive, and growing. It is more common than many of the diseases that dominate headlines, it costs the country an enormous amount, and its prevalence has accelerated since 2019. Many chronic pain conditions are not fully explained by routine imaging or lab tests, which is exactly why the numbers matter: they make a private experience legible at the scale of a population.
Chronic pain costs the US more each year than heart disease, cancer, or diabetes.
Sources: CDC National Health Interview Survey, 2023 (NCHS Data Brief No. 518); Economic Costs of Chronic Pain, United States, 2021, Medical Care (2025); Gaskin and Richard, The Economic Costs of Pain in the United States, The Journal of Pain (2012); Global Burden of Disease low back pain analysis, The Lancet Rheumatology (2023); and the Institute of Medicine report Relieving Pain in America (2011). Figures are rounded and reflect the most recent data available as of 2026.
Fact Checked
Dr. Mohammed A. Fouda, MD
Dr. Fouda is a Neurosurgery research scholar. His work focus primarily on Brain tumor behavior and quality of life of cancer patients as well as biomedical engineering and medical device innovation.

How OneTwenty Works
Not your average
Checkup.
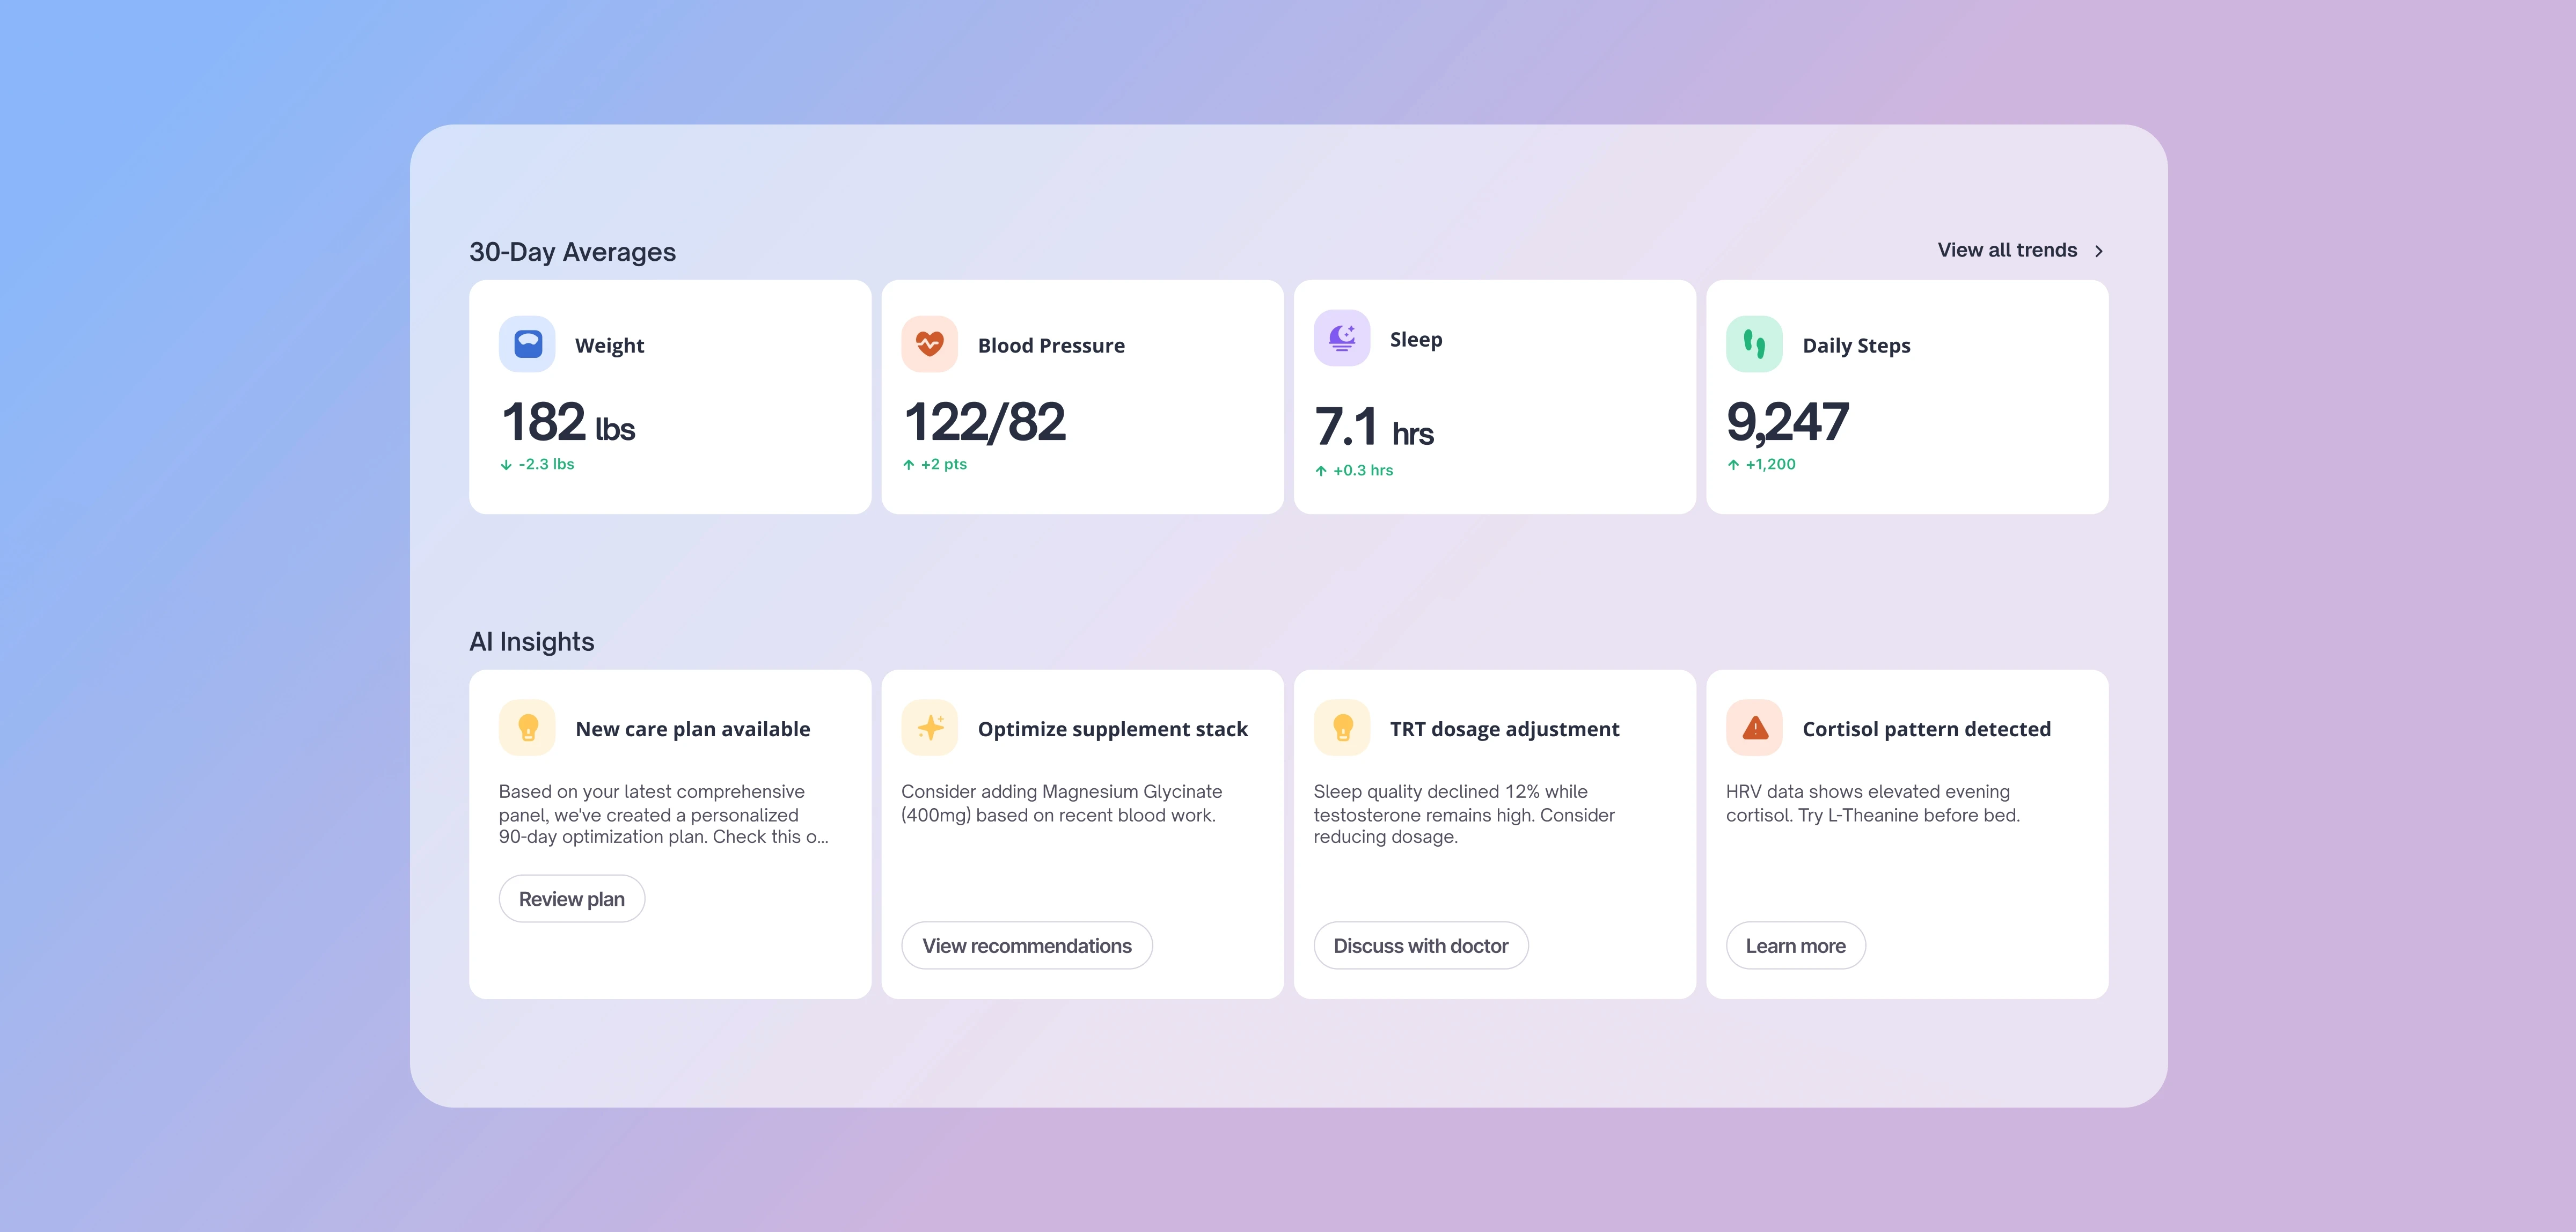
Every life stage brings new biological demands. Tracking the right metrics at the right time helps you adapt, optimize performance, and extend both lifespan and healthspan.
Your Annual Physical
Manual Data Processing
Guesswork Trend Detection
Once-a-year physical
Reactive, tested when sick
No data between visits
Once a year testing
Delayed Results
One-size dosing, set and forget
Real-Time Trend Insights
Daily smart-device data
Automated Data Sync
Quarterly Biomarker Tests
Optimal, personalized targets
Plain-language AI insights
Medications titrated to your data
Built to extend healthspan

Frequently Asked Questions
Clarity before
you commit
Answers on setup, scale, and support to remove blockers.